How to plan low temperature district heating systems?
What is district heating and the different types?
What are the different types of heat supply options?
What is the role of district heating in the future energy system?
How to plan low temperature district heating systems?
Introduction
This section presents an introduction to the planning process in general. Then each element is briefly described. [1].
Planning low temperature district heating systems
Policy
Each element is briefly introduced in the text
NOTE FROM GENERAL ASSEMBLY - Policy could a dd a section with reference to the most important policy documents at EU level, e.g. RED, EED, EPDB
Advanced page: Policy
Stakeholder engagement methodology
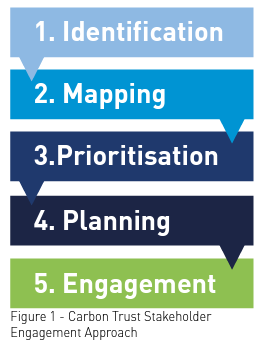
Stakeholder engagement has five main stages. [2]

Identification
Mapping
Prioritisation
Planning
Engagement
Advanced page: Stakeholder engagement methodology
Governance and Vision
Advanced page: Governance and Vision
Stakeholder roles and journeys
Advanced page: Stakeholder roles and journeys
Data collection (about heat from stakeholders)
Advanced page: Data collection (about heat from stakeholders)
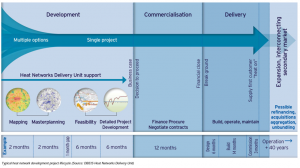
Heat mapping and energy master planning
Mapping heating
Mapping heating demands
Mapping district heating potential
Mapping district heat sources
Low temperature district heat sources
Calculating refurbishment requirements
Advanced page: Heat mapping and energy master planning
Techno-economic feasibility
Levelised Cost of Heat (LCOH)
Levelized cost of energy (LCOE) is a parameter that is used to assess the cost of total annual heat demand. It is calculated as a ratio of total discounted cost (CAPEX and OPEX) and total annual thermal demand. The value of LCOE is important when it comes to comparing energy systems that use different energy sources and technologies.

CAPEX
Capital expenditures (CAPEX) can be calculated by multiplying the capital recovery factor (CRF) with an investment cost of a certain element of a network (e.g., central heat pump, central heat exchanger, network cost, etc.). The capital recovery factor is used to calculate the present value of a series of equal annual cash payments which for the needs of this paper equals CAPEX. The value 𝑛 represents the lifetime (in years) of a certain part of a system, while the value 𝑖 represents the discount rate.
OPEX
Operating expenditures of a system (e.g., district heating network) can be calculated as a sum of operational and management costs (O&M) and electricity and/or gas consumption costs. These costs are ongoing throughout the year and can be calculated daily, weekly basis, or simply annual basis. O&M costs include inventory costs, repairs, overhauls, electricity (𝐸𝑖), and/or gas (𝐺𝑖) costs of all parts of the network, pay checks for employees, etc.
Plot ratio
Plot ratio is the ratio of the total (floor) area of buildings in a district/site to the total district/site area. If Plot ratio is 0.2 it represents areas of low population with a small buildings’ density. If plot ratios is equal to 2 it represents areas with high population with many buildings.
Space heating share is ratio of space heating demand and total thermal demand. For example, a space heating share of 0.8 means that 80% of the total specific annual heat demand is required for heating. The lower the space heating share is, the buildings are more energy efficient. 𝑆𝐻 share of 0.1 represents almost energy-neutral buildings.
Primary energy factor
Primary energy factor (PEF or 𝑓𝑝𝑟𝑖𝑚) indicates how much primary energy is used to generate a unit of electricity or a unit of useable thermal energy. The value of 𝑓𝑝𝑟𝑖𝑚,𝑠𝑐𝑒𝑛𝑎𝑟𝑖𝑜 can be calculated for each scenario that differs from others in energy consumption. First, total electricity or gas consumption was converted to primary energy. The result was then divided with total annual heat demand to calculate the 𝑓𝑝𝑟𝑖𝑚,𝑠𝑐𝑒𝑛𝑎𝑟𝑖𝑜 of each scenario. Scenarios with higher electricity consumption have higher primary energy factors. Results have shown that every low and ultra-low temperature district heating case has a lower primary energy factor than primary energy factor for individual gas boiler heating which factor has a value of 1,205.
Carbon emission factor
Carbon emission factor (CEF or 𝑓𝐶𝑂2) indicates how much 𝐶𝑂2 gasses were emitted into the atmosphere to generate a unit of electricity or a unit of useable thermal energy. The value of 𝑓𝐶𝑂2,𝑠𝑐𝑒𝑛𝑎𝑟𝑖𝑜 can be calculated for each scenario that differs from others in energy consumption. First, total electricity or gas consumption was converted to the equivalent amount of carbon dioxide emissions. The result was then divided with total annual heat demand to calculate the CEF of each scenario.
Predesign tool
Open-source, GIS-based tool for the predesign of district heating and cooling networks (DHCNs) with multiple energy sources, focusing on supporting the increased integration of low-temperature renewable (RE) and waste heat (WH) sources at urban level into thermal grids conceived under the neutral-temperature design and operation
- Preliminary techno-economic evaluation of neutral-temperature bidirectional networks based on yearly calculations with hourly resolution accounting for the impact of network temperature levels. Specific network topologies, centralised and distributed energy assets, design guidelines and operational constraints for these networks are considered.
- Mapping of energy resource potential from low-temperature RE/WH sources in cities
- Combination of GIS-based information for energy demand and resource estimation together with the above-mentioned dedicated modelling approach

LCOH calculation tool
Predesign tool
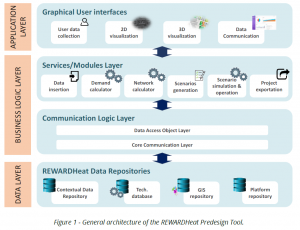
The general software architecture distributed into 3 main layers: (i) Data layer; (ii) Business Logic Layer; and (iii) Application Layer. The first two layers comprise the tool backend, while the Application Layer represents the tool frontend or Graphical User Interface (GUI).
- The Data Layer contains the data repositories where the general project information, GIS data of the target urban areas (buildings, sources, roads, etc.), technology data and other contextual information (e.g. weather data, economic and environmental reference indicators, etc.) will be stored.
- The Business Logic Layer connects the data layer to the application layer and controls the overall functionality of the tool by performing the main calculations and data processing. Different scripts will implement the core services/modules dedicated to energy demand calculation, network route design and network energy modelling and simulation.
- The Application Layer acts as the point of interaction between the REWARDHeat predesign tool and the user. It will be used for data insertion and results visualization, including the supporting warnings and guidance to the user across the tool workflow.
Other tools
PLANHEAT [1], THERMOS [2], Hotmaps [3], City Energy Analyst [4], SimStadt [5], INDIGO [6]
Advanced page: Techno-economic feasibility
Detailed project development
ULTDH When it comes to network layout, the two different layouts have been developed: ring layout and tree (mesh) layout. In traditional, tree structure network, consumers close to power plant have higher differential pressures which can cause that there is more water flow at their substation, while substations that are located far away from plant have lower pressures which can lead to insufficient heating. To battle this problem valves are being installed to increase flow resistance until desirable flow at each consumer substation is achieved [41].
Advanced page: Detailed project development
Commercialisation
Price setting
Advanced page: Commercialisation
Construction
Advanced page: Construction
Operation
Advanced page: Operation
